Quick Facts
- Current Support Floor: $4,500 (Historical J.P. Morgan structural lift level)
- Median 2026 Target: $4,916 per ounce (Aggregated survey of 31 institutional analysts)
- Primary Pivot Point: $4,701.55 for confirming bullish momentum
- Market Driver: Q1 2026 record central bank demand totaling $193 billion
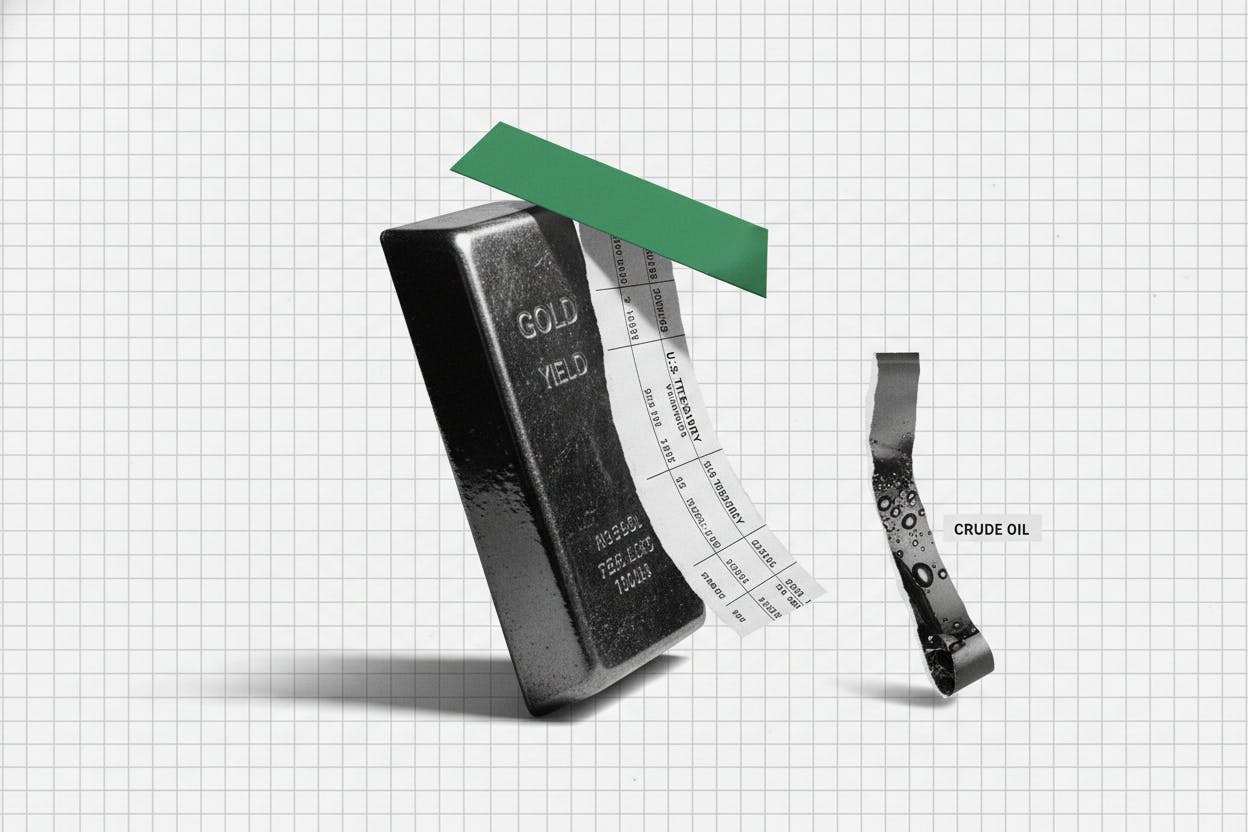
- Key Headwind: Oil prices sustained above $110/bbl keeping yield curves elevated
- Real Yield Focus: Real rates calculated as Nominal Treasury Note rate minus Inflation break-even rate
Gold investment analysis reveals that the metal remains a resilient buy above the $4,500 mark as of mid-2026, primarily supported by persistent central bank accumulation and deep-seated geopolitical risk premiums. While this $4,500 level acts as a significant structural floor, the market is currently consolidating within a strategic range of $4,670 to $4,880, suggesting that long-term investors should view pullbacks to support as entry opportunities before a potential breakout toward year-end targets.
Is $4,500 the New Floor? 2026 Gold Market Overview
The financial landscape of mid-2026 has redefined what investors consider a safe entry point for bullion. For years, the psychological barrier of $2,000 stood as the ultimate ceiling; today, we view $4,500 as the foundational basement. This shift is not merely a result of retail sentiment but is backed by a major institutional sea change. In February 2026, J.P. Morgan raised its structural long-term forecast for gold to $4,500 per ounce, citing a new valuation framework that accounts for persistent fiscal deficits and a transformed global reserve system.
Current gold investment strategy at $4500 involves recognizing that while the price is at a historical peak, the underlying valuation metrics have evolved. We are seeing a market that is consolidating between $4,670 and $4,880. For the disciplined allocator, this consolidation represents a cooling-off period after the rapid ascent of late 2025. Long term gold price targets for 2026 market analysis remain aggressive, with many desk analysts projecting a climb toward $5,400 or even $6,000 by the fourth quarter if safe-haven demand remains elevated.
The current gold investment analysis suggests that the $4,500 floor is defended by a "buy the dip" mentality that has shifted from speculative traders to sovereign wealth funds. These entities are less concerned with short-term price volatility and more focused on long-term purchasing power protection in an era where the US Dollar Index (DXY) faces structural headwinds despite high nominal interest rates.
The Engine of Price Action: Real Yields and Treasury Yield Impact
To understand why gold is holding value despite a 10-year Treasury Note yielding over 4.5%, we must look deeper than the nominal figures. Historically, gold and bond yields share an inverse relationship. When yields go up, gold—which offers no yield—typically goes down. However, the impact of treasury yields on gold has become more nuanced. The traditional inverse correlation between gold prices and U.S. Treasury yields broke down in 2025 as both assets rose simultaneously in response to U.S. fiscal uncertainty and geopolitical turmoil.
The real driver in 2026 is the real yields and gold price relation. If inflation expectations rise faster than the Federal Reserve can or will raise rates, the real yield—the actual return after inflation—remains low or even moves into negative territory.
Real Yields Formula: Real Yield = Nominal 10-Year Treasury Yield – Inflation Break-even Rate
Currently, interpreting real yields for gold investment decisions is the single most important skill for a macro strategist. With the 10-year Treasury Note sitting at 4.552%, but inflation stickiness keeping the break-even rate near 4.8%, the real yield is effectively negative. In such an environment, gold is not just a commodity; it is a superior form of "zero-yield" currency that doesn't suffer the 4-5% annual purchasing power erosion affecting fiat cash. This dynamic explains why we see continued asset allocation strategy shifts toward metals even when monetary tightening is the headline narrative.
Institutional Pillars: The Impact of Central Bank Accumulation
While retail investors often focus on technical indicators, the true support for the $4,500 floor comes from the official sector. In the first quarter of 2026 alone, central banks purchased a staggering $193 billion worth of gold. This is not speculative trading; it is a strategic move toward diversification and purchasing power protection. The impact of central bank accumulation on gold price floors cannot be overstated. These buyers are price-insensitive; they buy on a schedule and on a scale that provides a massive cushion against traditional market sell-offs.
Our gold investment analysis indicates that this central bank "bid" has effectively decoupled gold from the US Dollar Index (DXY) to a certain degree. In previous cycles, a strong dollar was a death knell for gold prices. In 2026, we see the dollar remain strong due to high interest rates, yet gold continues to hit new highs. This is a classic safe-haven demand response. Global institutions are looking for assets that sit outside the traditional credit system, and gold—specifically the XAU/USD pair—remains the most liquid and trusted option.
Technical Triggers: Predicting the Next Breakout
For those looking for specific entry and exit signals, predicting gold price breakouts using treasury yield data requires a close eye on specific pivot points. The market is currently identifying $4,701.55 as the key intermediate pivot. A daily close above this level likely signals a move toward the upper resistance at $4,880.
Conversely, risk management for buying gold at historical price peaks requires setting strict stop-losses or taking a "staggered entry" approach. If the price slides below $4,500, we may see a temporary flush of speculative long positions, providing an even better entry around $4,350. However, the current momentum suggests that the 50-day moving average is providing a firm slope for the uptrend.
| Indicator | Value/Level | Strategic Significance |
|---|---|---|
| Structural Floor | $4,500 | Strong institutional support; JPM forecast level |
| Momentum Pivot | $4,701.55 | Breakout trigger for short-term traders |
| Upper Resistance | $4,880 | Range cap; breakout point for $5k+ journey |
| 10-Year Yield Ceiling | 4.75% | Potential headwind if yields spike beyond this |
| Oil Inflation Trigger | $115/bbl | High oil prices may force higher yields, capping gold |
One of the secondary factors we are monitoring is how fluctuating oil prices influence gold inflation hedges. Energy prices remained volatile throughout early 2026. When oil prices soften, inflation fears often cool, which helps stabilize long-term Treasury yields and limits the downward pressure on gold. If energy prices spike again, the "inflation hedge" narrative will likely drive gold past the $5,000 threshold regardless of what the Federal Reserve does with interest rates.
Strategic Allocation: Gold in a Diversified 2026 Portfolio
In the context of modern portfolio management, the question is no longer if you should own gold, but how much and in what form. A gold investment strategy at $4500 should emphasize balance. While physical bullion like the 24k Gold American Buffalo offers the ultimate security, metal ETFs or gold-backed tokens provide the liquidity needed for tactical adjustments.
As part of a broader asset allocation strategy, we are also seeing institutional interest bleed into other precious metals. Silver and platinum are being used as "catch-up" trades. The following table illustrates the median forecasts for the primary precious metals for the remainder of 2026:
| Metal | 2026 Target (Median) | Key Driver |
|---|---|---|
| Gold | $4,916 - $5,400 | Central bank demand & Real yields |
| Silver | $52.00 - $60.00 | Industrial demand & Gold correlation |
| Platinum | $2,400 | Supply deficits & Green energy tech |
For most long-term investors, gold investment analysis suggests that maintaining a 5% to 10% allocation provides the necessary protection against systemic volatility. In a year where fiscal deficits are a primary concern for the bond market, gold acts as a hedge against the possibility that Treasury yields might not be enough to compensate for the risk of over-supply.
FAQ
Which factors drive the price of gold?
The price of gold is primarily driven by central bank demand, real interest rates, and geopolitical stability. In 2026, we are also seeing a significant influence from fiscal policy uncertainty and the global trend toward diversifying reserve assets away from a single-currency system.
How do interest rates affect gold investment?
Interest rates represent the opportunity cost of holding gold. High interest rates generally make bonds more attractive because gold pays no dividends or interest. However, the impact of treasury yields on gold is mitigated when inflation is high. If the real yield (nominal rate minus inflation) is low or negative, gold remains highly attractive despite high nominal rates.
How do I analyze gold price trends?
Analyzing gold price trends involves looking at both macro fundamentals and technical indicators. Follow the XAU/USD pair price action relative to the 50-day and 200-day moving averages. Regionally, monitor the US Dollar Index (DXY) and the 10-year Treasury Note yields, as these are the primary macro anchors for gold’s valuation.
What percentage of a portfolio should be gold?
Financial advisors and portfolio strategy editors typically recommend an allocation of 5% to 15% for gold, depending on an individual’s risk tolerance and the current economic climate. In 2026, many institutional models have tilted toward the higher end of this range due to increased global macro volatility.
Does gold perform well during a recession?
Historically, gold is one of the top-performing assets during an economic recession. As equity markets decline and central banks typically lower interest rates to stimulate the economy, the resulting drop in real yields and the search for safe-haven demand usually drive gold prices higher.